gOGig vs PPT-based campaign reporting: which actually works in 2026
2 min read

A practical 2026 survey integrity playbook for consumer insights heads, brand managers, market research agency leads, U&A study commissioners, NPS programme owners, and CFOs evaluating market research data quality. Built around the academic + industry consensus on interviewer falsification, the 9 fraud patterns specific to field-collected surveys, and the layered prevention stack that combines GPS + behavioral + statistical + AI detection.
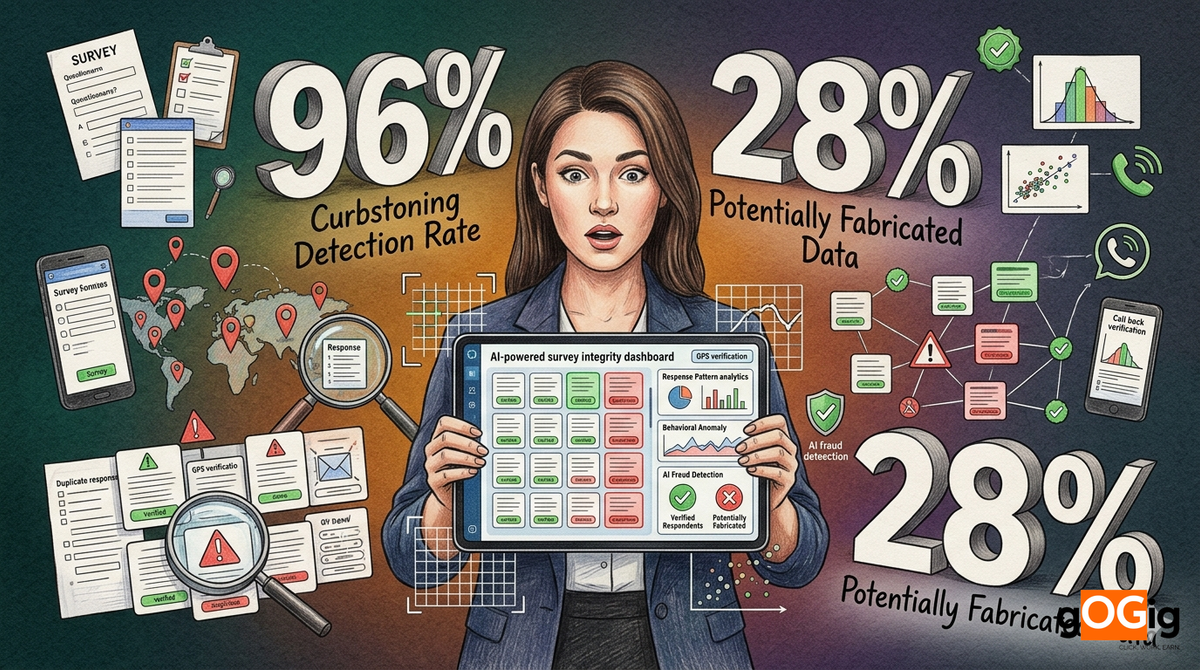
96%
Detection rate when interviewer behavior analysis (timing, scrolling, response patterns) is applied to curbstoning interviewers unaware of the detection system, per peer-reviewed research. Even when interviewers know the system exists, detection rates remain around 86%. Combined with GPS, OTP, and statistical distribution checks, curbstoning becomes practically impossible to hide. The 2026 question is no longer "is curbstoning happening?". The question is "how much of last quarter's research did we already make decisions on without knowing?".
A consumer durable brand commissions a Usage & Attitude (U&A) study across 5,000 consumers in 40 cities. ₹35 L research budget. 18 field interviewer teams across regional agencies. 6-week timeline. The brand manager opens the final dataset on a Friday afternoon. Sample size matches the brief. Demographic distribution looks textbook. Brand awareness scores cluster around expected ranges. Everything passes the smoke test. The CFO asks one question at the campaign review: "How do we know these are real consumers and not 1,200 invented respondents from a couple of fatigued interviewers?". Silence. Three weeks later, an internal post-hoc audit runs a recontact check on 200 randomly selected respondents. 38 cannot be reached. 22 deny ever being interviewed. 14 say they were interviewed but answered different questions. The study sample was 5,000. The verifiable sample is closer to 3,600. The brand launched a product positioning informed by 28% fabricated data. The brand manager learns the most expensive lesson in market research: a survey is not insight. A verifiable survey is insight.
Curbstoning
Curbstoning is the willful fabrication of survey responses by field interviewers, data collectors, auditors, or research assistants instead of conducting real interviews with actual respondents. The term was coined by the U.S. Census Bureau and entered the academic literature in 1981 (Werker) and 1985 (Ericksen & Kadane). It refers to an interviewer "sitting on the curbstone" filling out questionnaires instead of knocking on doors. The modern equivalent: an interviewer sitting in a tea shop filling in 40 surveys instead of conducting 40 real interviews.
Survey data falsification
Curbstoning is the most extreme form of survey falsification. Other forms include: item-level falsification (recording wrong answers to specific questions to reduce administration time), respondent substitution (interviewing a different person and coding as the assigned one), screen-out manipulation (coding eligible respondents as ineligible to skip the long survey), and data shifting (copying answers from one respondent to another). All falsification corrupts inference.
| Why it is harder than other research fraud | Detail |
|---|---|
| Looks completely normal | A fabricated dataset is internally consistent; outliers can be smoothed; results land in expected ranges |
| Human-generated, not bot-generated | Bots leave digital fingerprints; humans do not |
| Operationally hidden | Brand HQ never meets the respondent; only interviewer and supervisor know |
| Brand cannot independently verify at scale | 40 cities, 5,000 respondents; manual recontact is expensive |
| Drives wrong business decisions | Product positioning, pricing, geographic launch, target segment all based on fabricated input |
| Compounds over study cycles | Curbstoning that goes undetected in one wave can persist for years |
| Vendor reputational damage | Agency may not even know individual interviewers are curbstoning |
| Subset bias risk | Even small curbstoning rates (3-5%) can heavily skew sub-group estimates |
| Difficult to detect statistically with small samples | Statistical fraud detection works best at n>500 per interviewer |
| Often discovered too late | Brand has acted on the data before audit catches it |
| Root cause | Mechanism |
|---|---|
| Workload pressure | Interviewer assigned 12+ interviews/day in spread-out geography; physically impossible |
| Per-survey payment incentive | Pay tied to count; faster fake completion = more income |
| Weak supervision | 1 supervisor per 20-40 interviewers; impossible to observe all |
| Respondent unavailability | Door knocks unsuccessful; deadline pressure leads to fabrication |
| Lack of GPS / time tracking | No system to verify interviewer was actually at respondent location |
| Operational opacity | Excel / PDF submission workflow; no audit trail; supervisor trust-based |
Whole-interview fabrication (classic curbstoning)
Interviewer never meets the respondent. Entire questionnaire invented. Most extreme form. Detectable by GPS + recontact + behavioral pattern.
5-14%
of surveys
Speed-running (impossibly fast completion)
15-minute survey completed in 90 seconds. CARI timestamp analysis catches it. Statistical timing distributions catch it at scale.
8-18%
of surveys
Response-pattern stereotyping
Interviewer fills in "agree" on every Likert item, "5" on every 1-7 scale, or alternating patterns (1-2-3-1-2-3). Bredl-Winker style analysis catches deviation from natural variance.
10-22%
of surveys
Demographic profile duplication
Same demographic profile (age, income, family size) repeated across multiple "respondents". Cross-record similarity analysis catches it.
6-14%
of surveys
Respondent substitution (proxy interview)
Real interview, wrong respondent. Friend, household member, easy-to-find proxy fills in for the assigned respondent. OTP confirmation catches it.
8-16%
of surveys
Screen-out manipulation
Eligible respondent coded as ineligible to avoid the long survey. Easier interviews completed in their place. Screen-out rate per interviewer reveals the pattern.
4-10%
of surveys
Item-level falsification (selective fabrication)
Real interview, fake answers to burdensome questions. Most common in long surveys. Probe / open-ended responses become repetitive across interviewers.
10-26%
of surveys
Distribution-deviation fraud
Interviewer answers do not follow expected statistical distributions (e.g. last digits of age skew to 0/5 — known as Benford-Newcomb anomaly). Distribution checks catch it.
8-18%
of surveys
Cross-interviewer collusion
Multiple interviewers in same agency coordinate on fake answer patterns. Cluster analysis detects unnatural cross-interviewer similarity.
3-9%
of surveys
| Study parameter | Typical India consumer research study |
|---|---|
| Sample size | 1,000-10,000 respondents |
| Cities covered | 4-40 |
| Field interviewers deployed | 20-180 |
| Survey length | 20-60 minutes per interview |
| Total interview hours | 500-10,000 hours |
| Avg per-survey cost | ₹350-2,500 |
| Total study budget | ₹5 L - 3 Cr |
| Field timeline | 2-12 weeks |
| Supervisor capacity | 1 per 20-40 interviewers (sparse) |
| Manual recontact verification capacity | 5-10% of sample |
| Estimated curbstoning rate (uncontrolled) | 5-26% |
| Cost of decision-making error (downstream) | ₹50 L - ₹50 Cr (product launch, pricing, positioning failures) |
Geofenced survey capture
Interview can only be marked complete when interviewer is physically inside the assigned location radius. 25-50m geofence around respondent address or block. App rejects submission if interviewer is outside. 9-layer mock-location detection catches GPS spoofing apps. Indoor GPS degradation is handled via cellular triangulation and WiFi cross-check.
Server-side timestamp validation
Every question response carries authoritative server time, independent of device clock. Device clocks can be manipulated. Server timestamps cannot. Question-by-question timing creates a forensic record. Sub-minute survey completion on a 15-minute instrument is automatically flagged. Per-question time distributions are compared against the calibration baseline.
Behavioral pattern tracking (CARI-style)
Survey timing, scrolling behavior, response navigation, item-level pauses. Detects 96% of unaware curbstoners. App captures micro-interactions: dwell time per question, scroll behavior, back-tracking, response correction frequency. Honest interviews have natural variance; fabricated interviews show flat, mechanical behavioral signatures. Per-interviewer behavioral baseline used as comparator.
Voice / audio capture for verification
Random voice clip captured during interview (with consent). Curbstoning interviewer has no second voice to provide. App randomly records 5-15 second consent-authorised voice snippets from respondent during interview. Audio fingerprinting catches reuse across respondents. Voice diarisation confirms two-speaker conversation. Eliminates fabricated solo-voice "interviews".
Respondent OTP confirmation
SMS OTP sent to respondent's registered mobile at end of interview. Required to mark survey complete. After main questionnaire is captured, an OTP is sent to respondent's mobile (validated against telecom database). Respondent reads OTP to interviewer; interviewer enters in app. Without correct OTP, survey cannot be submitted as complete. Catches both whole-fabrication and respondent substitution.
Statistical distribution analysis
Real respondent answers follow known distributions. Fabricated answers deviate. Detection rate 48-90% depending on method. Bredl-Winker style analysis: nonresponse ratio, extreme-response style, middle-response style, acquiescence rate, Benford-Newcomb digit distribution on ages and income, demographic-cross-tabulation consistency. Combined methods reduce false positives to under 1%.
Recontact audit (10-15% random sample)
Independent team recontacts a sample of respondents post-interview. The most extensively validated detection method in the academic literature. 10-15% random sample. Independent agency (not original interviewer's team) recontacts. 3 questions: did the interview happen? Did this interviewer visit? Were these your responses? Discrepancy rate per interviewer drives Tier classification. Per-interviewer scorecard refreshed after every wave.
Interviewer face-match + Aadhaar identity
Catches the "wrong interviewer fielded the survey" pattern. Buddy-interview fraud is real. Interviewer logs into the app via face-match against Aadhaar-validated photo. Re-prompt every 4-6 hours during long field days. Cross-survey identity consistency check catches identity rotation across assignments.
AI anomaly detection (network-scale pattern detection)
Cross-interviewer, cross-city, cross-study pattern analysis. Catches what individual-level checks miss. Network-wide AI flags suspicious clusters: interviewers with statistically improbable consistency, agencies with systemic deviations from norm, cross-study response pattern repetition, demographic profile re-use across waves. Per-agency and per-interviewer rolling scorecards.
Catch curbstoning before it corrupts your decisions
Free 30-Day Verification Challenge on one consumer research study. Geofenced survey capture + face-matched interviewer + server-side timestamps + behavioral pattern tracking + respondent OTP + voice verification + statistical distribution analysis + 10-15% recontact audit + AI anomaly detection. Field force continues using existing CAPI / mobile app. 100% verification accuracy. 100% fraud detection rate.
Request a research verification pilot →| Red flag signal | Detail |
|---|---|
| Extremely fast survey completion times | Per interviewer (less than 60% of median) |
| Low item-level variance | Across interviewer's respondents (almost identical Likert patterns) |
| Repeated demographic profiles | Across respondents (same age, income bracket, family size) |
| Impossibly long field days | 15-hour shifts with 12+ completed interviews |
| GPS inconsistency or missing GPS | Across an interviewer's submissions |
| Unusually clean datasets | No skipped questions, no "Don't know", no refusals |
| Productivity outliers | A few interviewers completing 2-3x the team average |
| Last-digit clustering | On age / income / household members (skews to 0 and 5) |
| Cross-interviewer text similarity | On open-ended / probe responses |
| Brand awareness scores showing zero variance | Across geography or demography |
| OTP confirmation drop-off | When system is introduced mid-fieldwork |
| Recontact failure rate over 15% | On random sample |
| Live dashboard metric | Value |
|---|---|
| Study | FMCG_BRAND_HEALTH_TRACK_Q2 |
| Planned sample | 5,000 respondents |
| Completed (interviewer-submitted) | 4,872 |
| Verified completed (GPS + OTP + behavior) | 4,621 (94.8%) |
| Flagged for review | 187 |
| Rejected (curbstoning detected) | 64 |
| Re-fielding required | 251 surveys |
| Speed-running flags (Pattern 02) | 42 |
| Response-pattern stereotyping flags | 38 |
| Distribution-deviation flags | 28 |
| OTP confirmation failure | 22 |
| Mock-location flags | 8 |
| Voice verification fail (single-speaker) | 14 |
| Recontact audit (10% sample) | 486 of 500 confirmed (97.2%) |
| Per-interviewer Tier A+ | 112 of 142 |
| Per-interviewer Tier C (intervention) | 11 of 142 |
| Per-interviewer Tier D (suspended) | 3 of 142 |
| Per-agency average VER | Agency A: 96% | Agency B: 91% | Agency C: 78% |
| Verified Execution Rate (VER) | 94.8% |
| Insight defensibility score | 96.4% |
| Detection method | Effectiveness | Cost | Catches |
|---|---|---|---|
| Recontact audit (10-15% sample) | Highest (gold standard) | ₹80-250 per recontacted respondent | Pattern 01, 05, 07 |
| GPS + geofence verification | Very high | Software-only | Pattern 01 |
| Server timestamp + speed analysis | High | Software-only | Pattern 02 |
| Behavioral pattern tracking (CARI) | 96% (unaware) / 86% (aware) | Software-only | Pattern 01, 02, 03 |
| Statistical distribution analysis | 48-90% (method-dependent); <1% false positive when combined | Software-only | Pattern 03, 04, 08 |
| Voice / audio verification | High | Software + storage | Pattern 01, 05 |
| Respondent OTP | Very high | SMS cost ₹0.15-0.25 per survey | Pattern 01, 05 |
| Face-match interviewer identity | Very high | Software-only | Interviewer substitution |
| Cross-interviewer cluster analysis (AI) | High | Software-only | Pattern 09 |
| Combined 9-layer stack | ~100% | ~5-9% of study budget | All patterns |
| India market research / consumer insights indicator | Value |
|---|---|
| India market research industry size 2026 | $2.1B - 2.4B |
| India consumer panel respondents | 1.5M+ households tracked |
| India mystery shopping market | $150M |
| Top India research firms | NielsenIQ, Kantar, Ipsos, Hansa Research, GfK, MMR Research, GRG, Sambodhi, Markelytics |
| Top consumer panel providers | NielsenIQ Homescan, Kantar Worldpanel, IMRB / Kantar India |
| Avg face-to-face survey cost | ₹350-2,500 per completion |
| Avg phone / CATI survey cost | ₹150-600 per completion |
| Avg online survey cost | ₹40-300 per completion |
| Typical sample size (B2C consumer) | 500-10,000 |
| Field timeline | 2-12 weeks |
| Typical interviewer deployment | 20-180 per study |
| Cross-sectional study curbstoning rate | ≤5% identified; 14-26% in high-risk studies |
| Recontact verification best practice | 10-15% random sample |
| BRSR Core impact on research evidence chain | Top 250 → top 1,000 by FY 2026-27 |
| Business decision corrupted by ≥15% fabricated data | Typical business impact |
|---|---|
| Product launch positioning | ₹2-25 Cr (failed launch, repositioning cost) |
| Price elasticity-based pricing | ₹1-15 Cr (revenue left on table or market share loss) |
| Geographic launch sequence | ₹50 L - ₹8 Cr (wrong city first) |
| Target segment definition | ₹1-12 Cr (media spend on wrong audience) |
| Brand health tracking decisions | ₹2-20 Cr (campaign optimisation errors) |
| NPS-driven retention strategy | ₹30 L - ₹4 Cr (misallocated retention budget) |
| Distribution / channel expansion | ₹1-10 Cr (wrong channel mix decision) |
| Competitive positioning shift | ₹2-30 Cr (entering wrong battle) |
| Total downstream cost of fabricated insights | 10-50x the research budget itself |
| Study size | Verification cost (gOGig) | Decision-error prevented | Net ROI |
|---|---|---|---|
| Small (n=500, ₹5 L study) | ₹25,000-50,000 | ₹50 L - 2 Cr (decision-cascade) | 20-40x downstream |
| Medium (n=2,000, ₹15 L study) | ₹80,000-1.5 L | ₹2-10 Cr | 15-50x downstream |
| Large (n=5,000, ₹35 L study) | ₹1.8-3.2 L | ₹5-25 Cr | 15-80x downstream |
| National U&A / brand health (n=10,000) | ₹4-7 L | ₹10-50 Cr | 20-100x downstream |
| Continuous tracking (n=2,000/month × 12) | ₹14-25 L annual | ₹15-60 Cr | 30-200x downstream |
Curbstoning is not a research problem. It is a decision problem. A fabricated dataset does not produce wrong numbers in a vacuum; it produces wrong product launches, wrong pricing strategies, wrong geographic priorities, and wrong target segments. The cost of letting curbstoning continue is not the study budget. It is the next 3-5 years of business decisions made on fiction. Verification is not an expense. It is decision insurance.
Per-respondent unique ID with locked GPS coordinates + mobile number
9-layer mock-location detection on every interview submission
25-50m geofenced check-in at respondent address
Interviewer face-match + Aadhaar identity at app login
Server-side timestamp per question (CARI-grade)
Behavioral pattern tracking (timing, scrolling, dwell time, back-tracking)
Voice / audio verification on random subset (consent-based)
Respondent OTP confirmation required to mark complete
Statistical distribution analysis (Bredl-Winker, Benford-Newcomb, extreme-response)
Cross-interviewer cluster analysis
10-15% random recontact audit by independent team
Per-interviewer Tier A+ to D scorecard refreshed wave-by-wave
Per-agency Tier scorecard
Verified Execution Rate (VER) as contractual KPI
Insight defensibility score per study deliverable
Proof-Before-Payment workflow for invoice 3-way matching
7-year audit-grade evidence retention
BRSR Core / data-quality audit-ready evidence pack
Verified by gOGig certification or equivalent independent verification standard
gOGig's survey-integrity stack works across every field-collected research study type where interviewer falsification corrupts inference.
gOGig's curbstoning prevention runs across every major Indian metro, tier-1/tier-2 city, and rural cluster used in field-collected consumer research.
Catch curbstoning before it corrupts your decisions
Free 30-Day Verification Challenge on one consumer research study. Geofenced survey capture + face-matched interviewer + server-side timestamps + behavioral pattern tracking + respondent OTP + voice verification + statistical distribution analysis + 10-15% recontact audit + AI anomaly detection. Field force continues using existing CAPI / mobile app. 100% verification accuracy. 100% fraud detection rate.
100%
AI accuracy
100%
Detection rate
15-100x
Downstream ROI
Written by
gOGig Editorial Team
The gOGig Editorial team publishes research, frameworks, and field intelligence drawn from gOGig Labs' dataset of 10,000+ verified field submissions across FMCG, dairy, OOH, BTL, market research, pharma, security, telecom, and BFSI sectors.
Was this article helpful?
Your feedback helps us write better content.